Synology und Mac OS X Server Open-Directory (LDAP)

Im aktuellen DSM von Synology (DSM 3.2 Beta) kann man auch LDAP-Nutzer und Gruppen einbinden. Die Konfiguration ist dabei recht einfach: In der Systemsteuerung den Eintrag »LDAP« auswählen und den Server-Namen eintragen (beim ersten Test am besten keine Verschlüsselung wählen). Der Basis-DN entspricht dem im Server-Admin eingetragenen LDAP-Suchbeginn und anmelden kann man sich z.B. mit einem eigenen Nutzer (diradmin o.ä.). Der Bind erfolgt mit vollständigem DN, also der Kombination aus Basis-DN und Nutzer (die in cn=users liegen). Wenn also der Basis-DN dc=ldap,dc=domain,dc=tld lautet, so erfolgt der Bind via User diradmin z.B. mit uid=diradmin,cn=users,dc=ldap,dc=domain,dc=tld

Eine Besonderheit fällt auf: Wenn für den Nutzer im Open-Directory über den Arbeitsgruppenmanager verschiedene Kurznamen (Reiter »Allgemein«) für einen Nutzer vergeben wurden, werden diese im Attribut uid gespeichert. Dies führt dazu, dass der LDAP-Nutzer auf der Synology unter dem letzten Kurznamen in der Liste auftaucht. Ist der normale Nutzer-Account z.B. user1 und dessen letzte Kurzname Vorname.Nachname so taucht dieser User als Vorname.Nachname@ldap.domain.tld auf.

Using mod_security 2.5 and Apache 2 on Mac OS X

Unfortunately recent MacPorts comes with mod_security 1.8.6 and the maintainer is not actively supporting updates (for details see this ticket). Since I wanted to test some settings on a local Apache installation on my Mac with the latest release (2.5.11) I used the information given in the ticket to patch and update my mod_security port.

This guide is straight forward and shows just the required changes, a working MacPorts installation with Apache 2 is mandatory. You simply have to edit the Portfile that contains the details for mod_security.

Step-by-step explanation

  1. Update your MacPorts installation by sudo port selfupdate and sudo port upgrade outdated (read this guide for more details on MacPorts selfupdate)
  2. Open the portfile for mod_security and replace the content of the file with the provided code. The portfile in my installation resides in/opt/local/var/macports/sources/rsync.macports.org/ release/ports/www/mod_security/Portfile


    Download the Portfile as text file

  3. Now you may install mod_security via MacPorts using this terminal command:sudo port install mod_security
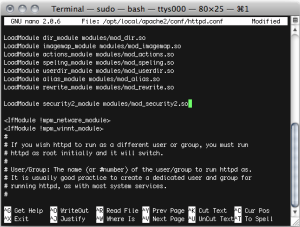
  4. Open the Apache configuration file (/opt/local/apache2/conf/httpd.conf) in a text editor and add mod_security to the list.Open a new Terminal (the Termin.app resides in /Applications/Utilities on your harddrive) window and then type the following command to open and edit the file (the sudo command is required to get write-access to this file since it is normally not writable for you user account).sudo nano /opt/local/apache2/conf/httpd.confNow enter your password (the same you use to log in to your Mac). Use the cursor keys to scroll down to the section for the Dynamic Shared Object (DSO) Support and copy the following line below the last LoadModule… statement (see screenshot).LoadModule security2_module modules/mod_security2.so

    To save and leave the Nano editor press CTRL+X and confirm with Y (for Yes) to save.

  5. Reload the Apache server. The security module should now be loaded by Apache (start or restart Apache to commit changes).sudo /opt/local/etc/LaunchDaemons/org.macports.apache2/apache2.wrapper restart

Endlich: OpenX 2.8

OpenX, eigentlich »die« Open-Source-Software zur Bannerverwaltung für Websites, ist in Version 2.8 erschienen. Zu den wesentlichen neuen Funktionen der Version 2.8 gehören eine neue Plugin-Architektur und der neue OpenX Market. Auch die Performance soll insgesamt deutlich verbessert worden sein.

Web Inspector Redesign

Timothy Hatcher writes:

Web Inspector Redesign: It has been nine months since our last Web Inspector update and we have a lot of cool things to talk about. If you diligently use the Web Inspector in nightly builds, you might have seen some of these improvements, while other subtle changes might have gone unnoticed.

Some of the Web Inspector improvements were contributed by members of the WebKit community. We really want to get the whole community involved with making this the best web development tool available. Remember, most of the Web Inspector is written in HTML, JavaScript, and CSS, so it’s easy to get started making changes and improvements.

Redesigned Interface

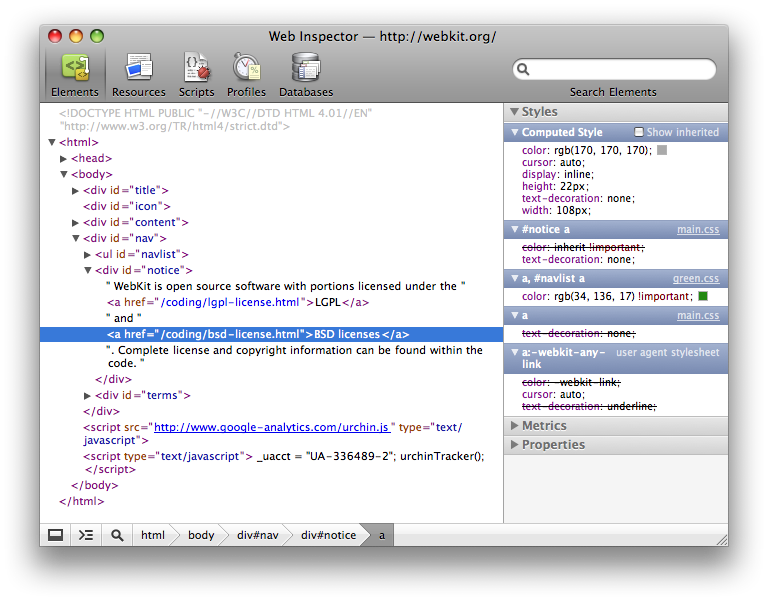
First and foremost, the Web Inspector is now sporting a new design that organizes information into task-oriented groups — represented by icons in the toolbar. The toolbar items (Elements, Resources, Scripts, Profiles and Databases) are named after the fundamental items you will work with inside the respective panels.

Console

The Console is now accessible from any panel. Unlike the other panels, the Console is not just used for one task — it might be used while inspecting the DOM, debugging JavaScript or analyzing HTML parse errors. The Console toggle button is found in the status bar, causing it to animate in and out from the bottom of the Web Inspector. The Console can also be toggled by the Escape key.

Error and warning counts are now shown in the bottom right corner of the status bar. Clicking on these will also open the Console.

In addition to the visual changes to the Console, we have also greatly improved usability by adding auto-completion and tab-completion. As you type expressions, property names will automatically be suggested. If there are multiple properties with the same prefix, pressing the Tab key will cycle through them. Pressing the Right arrow key will accept the current suggestion. The current suggestion will also be accepted when pressing the Tab key if there is only one matched property.

Our compatibility with Firebug’s command line and window.console APIs has also been greatly improved by Keishi Hattori (服部慶士), a student at The University of Tokyo (東京大学) who tackled this area as a summer project.

Elements Panel

The Elements panel is largely the same as the previous DOM view — at least visually. Under the hood we have made number of changes and unified everything into one DOM tree.

  • Descend into sub-documents — expanding a frame or object element will show you the DOM tree for the document inside that element.
  • Automatic updates — the DOM tree will update when nodes are added to or removed from the inspected page.
  • Inspect clicked elements — enabling the new inspect mode lets you hover around the page to find a node to inspect. Clicking on a node in the page will focus it in the Elements panel and turn off the inspect mode. This was contributed by Matt Lilek.
  • Temporarily disable style properties — hovering over an editable style rule will show checkboxes that let you disable individual properties.

  • Style property editing — double click to edit a style property. Deleting all the text will delete the property. Typing or pasting in multiple properties will add the new properties.
  • Stepping for numeric style values — while editing a style property value with a number, you can use the Up or Down keys to increment or decrement the number. Holding the Alt/Option key will step by 0.1, while holding the Shift key will step by 10.

  • DOM attribute editing — double click to edit a DOM element attribute. Typing or pasting in multiple attributes will add the new attributes. Deleting all the text will delete the attribute.
  • DOM property editing — double click to edit a DOM property in the Properties pane. Deleting all the text will delete the property, if allowed.
  • Metrics editing — double click to edit a any of the CSS box model metrics.
  • Position metrics — the Metrics pane now includes position info for absolute, relative and fixed positioned elements.

Resources Panel

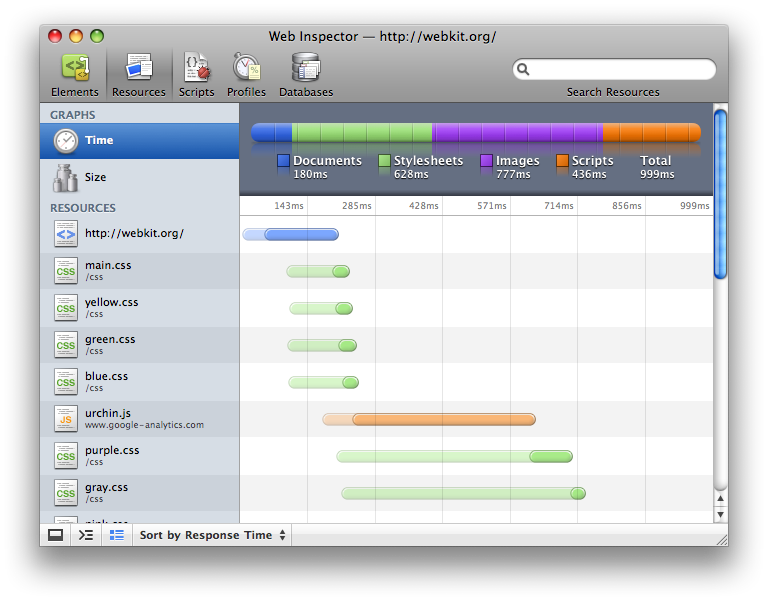
The Resources panel is a supercharged version of the previous Network panel. It has a similar looking timeline waterfall, but a lot has been done to make it even more useful.

  • Graph by size — click Size in the sidebar to quickly see the largest resources downloaded.
  • Multiple sorting options — there are many sorting methods available for the Time graph, including latency and duration.
  • Latency bars — the Time graph now shows latency in the bar with a lighter shade. This is the time between making the request and the server’s first response.
  • Unified resource views — clicking a resource in the sidebar will show you the data pulled from the network (not downloaded again), including the request and response headers.
  • View XHRs — the time and size graphs also show XMLHttpRequests. Selecting an XHR resource in the sidebar will show the XHR data and headers.

Scripts Panel

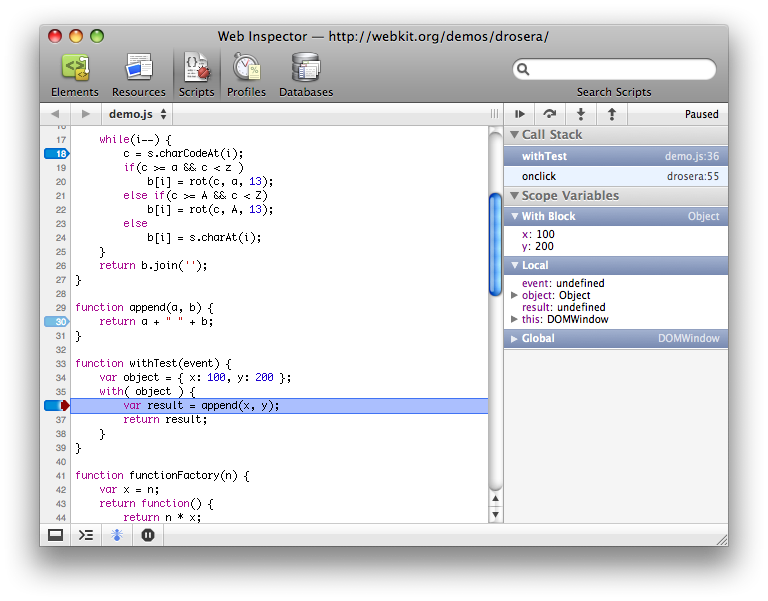
The previous standalone Drosera JavaScript debugger has been replaced with a new JavaScript debugger integrated into the Web Inspector. The new integrated JavaScript debugger is much faster than Drosera, and should be much more convenient.

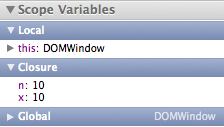
From the Scripts panel you can see all the script resources that are part of the inspected page. Clicking in the line gutter of the script will set a breakpoint for that line of code. There are the standard controls to pause, resume and step through the code. While paused you will see the current call stack and in-scope variables in the right-hand sidebar.

The Web inspector has a unique feature regarding in-scope variables: it shows closures, ‘with’ statements, and event-related scope objects separately. This gives you a clearer picture of where your variables are coming from and why things might be breaking (or even working correctly by accident).

Profiles Panel

The brand new JavaScript Profiler in the Profiles panel helps you identify where execution time is spent in your page’s JavaScript functions. The sidebar on the left lists all the recorded profiles and a tree view on the right shows the information gathered for the selected profile. Profiles that have the same name are grouped as sequential runs under a collapsible item in the sidebar.

There are two ways to view a profile: bottom up (heavy) or top down (tree). Each view has its own advantages. The heavy view allows you to understand which functions have the most performance impact and the calling paths to those functions. The tree view gives you an overall picture of the script’s calling structure, starting at the top of the call-stack.

Below the profile are a couple of data mining controls to facilitate the dissection of profile information. The focus button (Eye symbol) will filter the profile to only show the selected function and its callers. The exclude button (X symbol) will remove the selected function from the entire profile and charge its callers with the excluded function’s total time. While any of these data mining features are active, a reload button is available that will restore the profile to its original state.

WebKit’s JavaScript profiler is fully compatible with Firebug’s console.profile() and console.profileEnd() APIs, but you can also specify a title in console.profileEnd() to stop a specific profile if multiple profiles are being recorded. You can also record a profile using the Start/Stop Profiling button in the Profiles panel.

Databases Panel

The Databases panel lets you interact with HTML 5 Database storage. You can examine the contents of all of the page’s open databases and execute SQL queries against them. Each database is shown in the sidebar. Expanding a database’s disclosure triangle will show the database’s tables. Selecting a database table will show you a data grid containing all the columns and rows for that table.

Selecting a database in the sidebar will show an interactive console for evaluating SQL queries. The input in this console has auto-completion and tab-completion for common SQL words and phrases along with table names for the database.

Search

Accompanying the task-oriented reorganization, the search field in the toolbar now searches the current panel with results being highlighted in the context of the panel. Targeting the search to the current panel allows each panel to support specialized queries that are suited for the type of information being shown. The panels that support specialized queries are Elements and Profiles.

The Elements panel supports XPath and CSS selectors as queries in addition to plain text. Any search you perform will be attempted as a plain text search, a XPath query using document.evaluate() and a CSS selector using document.querySelectorAll(). All the search results will be highlighted in the DOM tree, with the first match being revealed and selected.

The Profiles panel supports plain text searches of the function names and resource URLs. Numeric searches are also supported that match rows in the profile’s Self, Total and Calls columns. To facilitate powerful numeric searching, there are a few operators and units that work to extend or limit your results. For example you can search for ‘> 2.5ms’ to find all the functions that took longer than 2.5 milliseconds to execute. In addition to ‘ms’, the other supported units are: ‘s’ for time in seconds and ‘%’ for percentage of time. The other supported operators are ‘< ’, ‘<=’, ‘>=’ and ‘=’. When no units are specified the Calls column is searched.

In all the panels pressing Enter in the search field or ⌘G (Ctrl+G on Windows and Linux) will reveal the next result. Pressing ⇧⌘G (Ctrl+Shift+G on Windows and Linux) will reveal the previous result. In the Resources, Scripts and Profiles panels the search will be performed on the visible view first and will automatically jump to the first result only if the visible view has a match.

Available Now and Contributing

All of these things are available now in the Mac and Windows nightly builds. Give them a try today, and let us know what you like (or don’t like).

If you would like to contribute, there are some really interesting tasks in the list of Web Inspector bugs and enhancements, and other contributors in the #webkit chat room are pretty much always available to provide help and advice.“

(Via Surfin‘ Safari.)

Internet Explorer 8: Wieder konkurrenzfähig

Die Konkurrenten Firefox, Safari und Opera knapsen dem Platzhirschen unter den Windows-Browsern, dem Internet Explorer, kontinuierlich Marktanteile ab – wohl auch, weil sie wesentlich konsequenter weiterentwickelt werden. Mit Release 8 des Internet Explorers findet Microsoft aber wieder Anschluss an die erste Browser-Liga, wie die Feature-vollständige Beta 2 zeigt. Sie steht auf den Microsoft-Servern für Vista, XP und Windows Server 2003 zum Herunterladen bereit.

Vollständiger Artikel bei heise.de

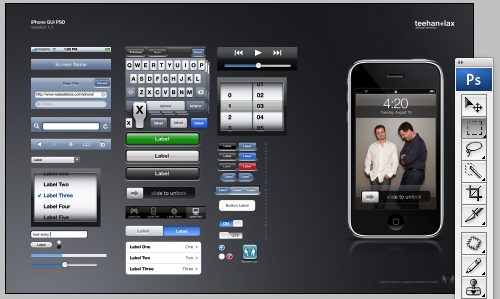
iPhone GUI PSD

iphone_gui.jpg

Over the past few months we’ve had to create a few iPhone mock ups for presentations. The problem we’ve encountered is the lack of resources to help us design something efficiently. Up until now we’ve used a nice PSD from 320480.com but we still found ourselves having to build out additional assets or heavily modifying bitmap based buttons and widgets.

Since we know we’ll be doing more of this, we created our own Photoshop file that has a fairly comprehensive library of assets – all fully editable.

(via fscklog.com)

Working With History in Bash

Working With History in Bash: „

Yesterday we talked about favorite bash features (on the ##textmate IRC channel). I figured it was worth posting mine to this blog, they mostly revolve around history, hence the title.

Setup

My shell history collects a lot of complex command invocations which take time to figure out. To ensure that I have access to them at a later time, I have the following 3 lines in my bash init:

export HISTCONTROL=erasedups
export HISTSIZE=10000
shopt -s histappend

The first one will remove duplicates from the history (when a new item is added). For example if you switch between running make and ./a.out in a shell, you may later find that the last 100 or so history items is a mix of these two commands. Not very useful.

The second one increase the history size. With duplicates erased, the history already holds a lot more actual information, but I still like to increase the default size of only 1,000 items.

The third line ensures that when you exit a shell, the history from that session is appended to ~/.bash_history. Without this, you might very well lose the history of entire sessions (rather weird that this is not enabled by default).

History Searching

Now that I have my history preserved nicely in ~/.bash_history there are a few ways to search it.

Using Grep

The most crude is grep. You can do:

history|grep iptables

For me (on this particular Linux server) I get:

4599  iptables -N http-block
4600  iptables -A http-block -s 58.60.43.196 -j DROP
4601  iptables -A INPUT -p tcp --dport 80 -j http-block
4602  iptables -L http-block
4603  iptables-save -c
4604  history|grep iptables

I do this often enough to have an alias for history (which is just h).

From the output I can either copy/paste the stuff I want, or repeat a given history event. You’ll notice that each history event has a number, you can repeat e.g. event number 4603 simply by running:

!4603

I will write a bit more about referencing history events in History Expansion.

Prefix Searching

Similar to how you can press arrow up for the previous history event, there is a function you can invoke for the previous history event with the same prefix as what is to the left of the insertion point.

This function is called history-search-backward and by default does not have a key equivalent. So to actually reach this function, I have the following in ~/.inputrc (or /etc/inputrc when I control the full system):

'\ep': history-search-backward

This places the function on P (escape P). So if I want to repeat the iptables-save -c history event we found in previous section, all I do is type ipt and hit P. If it finds a later event with the same prefix, hit P again to go further back.

This functionality is offered by the readline library, so if you setup this key, you have access to prefix searching in all commands which use this library.

Incremental Search

It is possible to press ⌃R to do an incremental (interactive) search of the history.

Personally I am not a big fan of this feature, so I will leave it at that :)

Update: The reason I dislike ⌃R is both because the interactive stuff just seems to get in the way (when P is what I need 99% of the time) and because it fails in cases where I ‘switch shell’, for example I may do: ssh mm press return, then instantly type: fP and again hit return (to execute free -m on the server called mm). I enter this before the connection to the server has been fully established, and here ⌃R would have been taken by the local shell, but it is the shell history at the server I want to search.

History Expansion

History Expansion was what we did above when we ran !4603. It is a DSL for referencing history events and optionally run transformations on these.

Anyone interested in this should run man bash and search for History Expansion, but just to give you a feel for what it is, I will reference a subset of the manual and provide a few examples.

Event Designators

First, an event designator starts with ! and then the event we want to reference. This can be:

«n»      Reference event number «n».
-«n»     Go «n» events back.
!        Last line (this is the default).
#        Current line.
«text»   Last event starting with «text».
?«text»  Last event containing «text».

So if we want to re-run our iptables-save -c we can do: !ipt.

What’s more useful though is to use history references as part of larger commands.

For example take this example:

% which ruby
/usr/bin/ruby
% ls -l $(!!)
lrwxr-xr-x  1 root  wheel  76 30 Oct  2007 /usr/bin/ruby -> ../../System/Library/Frameworks/Ruby.framework/Versions/Current/usr/bin/ruby

Or something like:

% make some_target
(no errors)
% path/to/target some arguments
(no errors)
% !-2 && !-1

Word Designators

In the previous section we referenced entire history events. It is possible to reference just a subset of a history event by appending a : to the event designator and then the word of interest, the two most useful are:

«n»      Reference the «n»’th word.
$        Reference the last word.

So for example we can do:

% mkdir -p /path/to/our/www-files
(no errors)
% chown www:www !$
(no errors)

Here we reference last word of last line. We can also reference stuff on the same line, e.g.:

% cp /path/to/important/file !#:1_backup

To reference the last word of last line one can also press _ which will immediately insert that word.

Modifiers

To make history substitution even more useful (and harder to remember), one can also add a modifier to the event designator.

The most useful modifiers are in my experience :h and :t, these are head and tail respectively or better know as dirname and basename.

An example could be:

% ls -l /path/to/some/file
(listing of file)
% cd !$:h
(change directory to that of file)

Brace Expansion

Somewhat related to the backup example where we reference the first argument as !#:1 and append _backup to this, another approach is bracket expansion.

Anywhere on a command line, one can write {a,b,c} which will expand to the 3 words a, b, and c. If we include a prefix/suffix, that will be part of each of the expanded words. We can also leave the word in the braces empty, and have it expand to just the prefix/suffix, so for example we can do:

% cp /path/to/important/file{,_backup}

This is functionally equivalent to:

% cp /path/to/important/file !#:1_backup

But lack of hardcoded word number is IMO an improvement.

(Via TextMate Blog.)

Internet Explorer 8: Beta 1 in deutscher Sprache

Internet Explorer 8: Beta 1 in deutscher Sprache: „Microsoft bietet ab sofort die Beta 1 des Internet Explorer 8 auch in deutscher Sprache an. Anfang März 2008 erschien die erste Vorabversion des kommenden Microsoft-Browsers zunächst nur in englischer Sprache. Bis auf die Lokalisierung unterscheiden sich die beiden Beta-Fassungen nicht. Der Browser unterstützt unter anderem CSS 2.1 sowie erste Teile von HTML 5 und mit Hilfe von ‚Web Slices‘ lassen sich einzelne Teile einer Website gesondert über die Favoriten-Leiste abrufen. (MSIE, Microsoft)“

(Via Golem.de.)

Safari 3.1

Safari 3.1 ist soweit und lässt sich ab sofort auf der Apple-Seite herunterladen – sowohl für den Mac als auch für Windows-PCs. Im Vorfeld hatte sich bereits anhand von Vorversionen gezeigt, dass die neue Version ein großer Wurf werden könnte.

Nun bestätigt Apple per Pressemitteilung: „Safari baut Webseiten bis zu 1,9 mal so schnell wie der Internet Explorer 7 und bis zu 1,7 mal so schnell wie Firefox 2 auf“. JavaScript sei bis zu sechs Mal schneller als bei anderen Browsern. Apple unterschlägt bei diesen Geschwindigkeitsangaben zwar, dass die Konkurrenz ebenfalls nicht schläft und Betaversionen von Firefox 3 bereits fast an die Geschwindigkeit von Safari herankommen – dennoch hat Apple unseren Tests zufolge derzeit die Nase vorn, sowohl in punkto Gewschwindigkeit als auch bei der Komaptibilität mit aktuellen und kommenden Web-Standards, wie der Acid3-Test beweist. Safari 3.1 unterstützt zudem als erster Browser sowohl Video- und Audio-Tags in HTML 5 als auch CSS Animationen und kommt darüber hinaus mit CSS Web Fonts zurecht. Voraussetzung ist mindestens Mac OS X 10.4.11, das Update ist über die Software-Aktualisierung erhältlich und für Leopard 39 Megabyte groß, der Tiger-Download zählt 49 Megabyte.

Apple Informationen zum Update: http://docs.info.apple.com/article.html?artnum=307467-de

Via macnews.de