Timothy Hatcher writes:
„Web Inspector Redesign: It has been nine months since our last Web Inspector update and we have a lot of cool things to talk about. If you diligently use the Web Inspector in nightly builds, you might have seen some of these improvements, while other subtle changes might have gone unnoticed.
Some of the Web Inspector improvements were contributed by members of the WebKit community. We really want to get the whole community involved with making this the best web development tool available. Remember, most of the Web Inspector is written in HTML, JavaScript, and CSS, so it’s easy to get started making changes and improvements.
Redesigned Interface
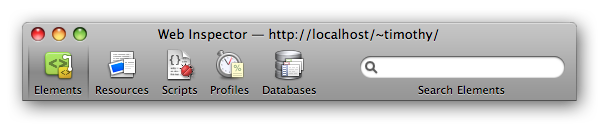
First and foremost, the Web Inspector is now sporting a new design that organizes information into task-oriented groups — represented by icons in the toolbar. The toolbar items (Elements, Resources, Scripts, Profiles and Databases) are named after the fundamental items you will work with inside the respective panels.
Console
The Console is now accessible from any panel. Unlike the other panels, the Console is not just used for one task — it might be used while inspecting the DOM, debugging JavaScript or analyzing HTML parse errors. The Console toggle button is found in the status bar, causing it to animate in and out from the bottom of the Web Inspector. The Console can also be toggled by the Escape key.
Error and warning counts are now shown in the bottom right corner of the status bar. Clicking on these will also open the Console.

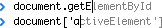
In addition to the visual changes to the Console, we have also greatly improved usability by adding auto-completion and tab-completion. As you type expressions, property names will automatically be suggested. If there are multiple properties with the same prefix, pressing the Tab key will cycle through them. Pressing the Right arrow key will accept the current suggestion. The current suggestion will also be accepted when pressing the Tab key if there is only one matched property.
Our compatibility with Firebug’s command line and window.console APIs has also been greatly improved by Keishi Hattori (服部慶士), a student at The University of Tokyo (東京大学) who tackled this area as a summer project.
Elements Panel
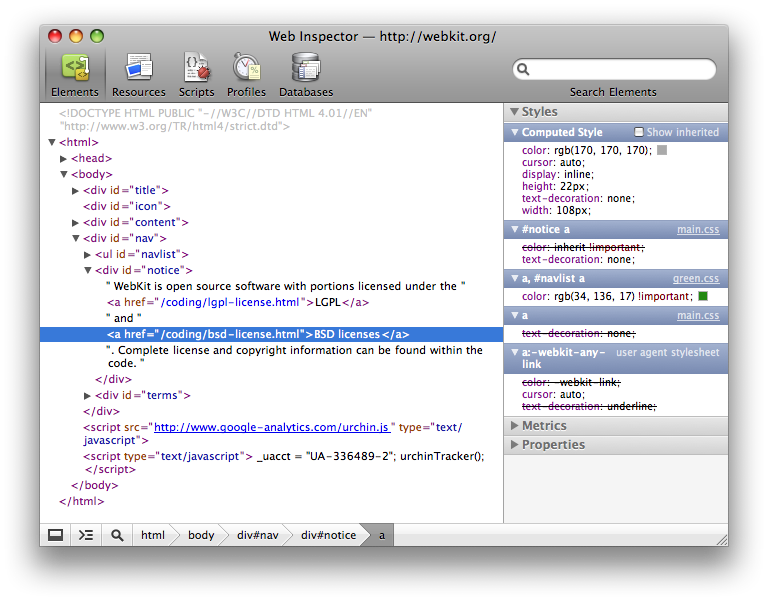
The Elements panel is largely the same as the previous DOM view — at least visually. Under the hood we have made number of changes and unified everything into one DOM tree.
- Descend into sub-documents — expanding a frame or object element will show you the DOM tree for the document inside that element.
- Automatic updates — the DOM tree will update when nodes are added to or removed from the inspected page.
- Inspect clicked elements — enabling the new inspect mode lets you hover around the page to find a node to inspect. Clicking on a node in the page will focus it in the Elements panel and turn off the inspect mode. This was contributed by Matt Lilek.
- Temporarily disable style properties — hovering over an editable style rule will show checkboxes that let you disable individual properties.
- Style property editing — double click to edit a style property. Deleting all the text will delete the property. Typing or pasting in multiple properties will add the new properties.
- Stepping for numeric style values — while editing a style property value with a number, you can use the Up or Down keys to increment or decrement the number. Holding the Alt/Option key will step by 0.1, while holding the Shift key will step by 10.
- DOM attribute editing — double click to edit a DOM element attribute. Typing or pasting in multiple attributes will add the new attributes. Deleting all the text will delete the attribute.
- DOM property editing — double click to edit a DOM property in the Properties pane. Deleting all the text will delete the property, if allowed.
- Metrics editing — double click to edit a any of the CSS box model metrics.
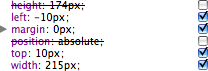
- Position metrics — the Metrics pane now includes position info for absolute, relative and fixed positioned elements.
Resources Panel
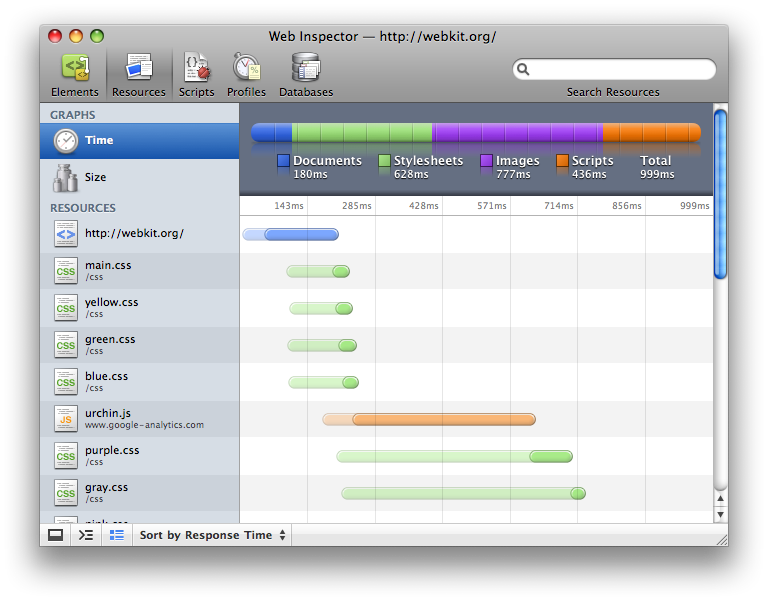
The Resources panel is a supercharged version of the previous Network panel. It has a similar looking timeline waterfall, but a lot has been done to make it even more useful.
- Graph by size — click Size in the sidebar to quickly see the largest resources downloaded.
- Multiple sorting options — there are many sorting methods available for the Time graph, including latency and duration.
- Latency bars — the Time graph now shows latency in the bar with a lighter shade. This is the time between making the request and the server’s first response.
- Unified resource views — clicking a resource in the sidebar will show you the data pulled from the network (not downloaded again), including the request and response headers.
- View XHRs — the time and size graphs also show XMLHttpRequests. Selecting an XHR resource in the sidebar will show the XHR data and headers.
Scripts Panel
The previous standalone Drosera JavaScript debugger has been replaced with a new JavaScript debugger integrated into the Web Inspector. The new integrated JavaScript debugger is much faster than Drosera, and should be much more convenient.
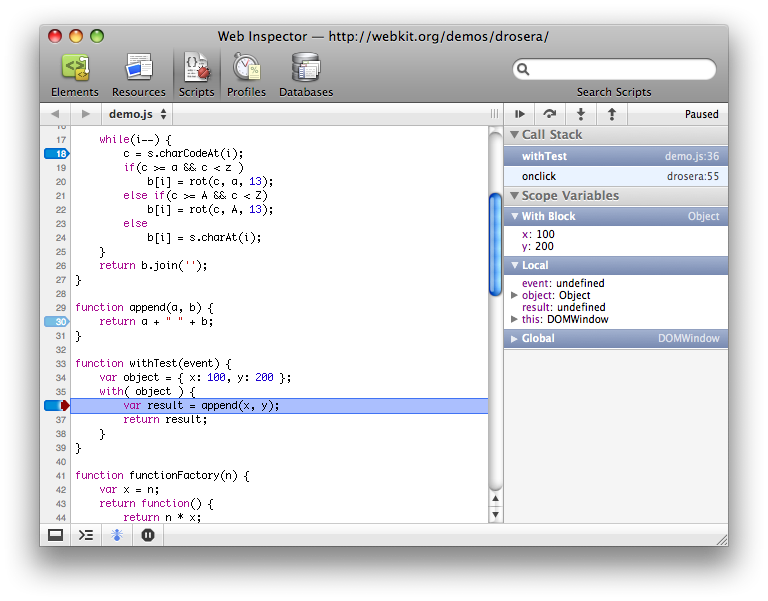
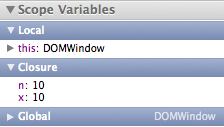
From the Scripts panel you can see all the script resources that are part of the inspected page. Clicking in the line gutter of the script will set a breakpoint for that line of code. There are the standard controls to pause, resume and step through the code. While paused you will see the current call stack and in-scope variables in the right-hand sidebar.
The Web inspector has a unique feature regarding in-scope variables: it shows closures, ‘with’ statements, and event-related scope objects separately. This gives you a clearer picture of where your variables are coming from and why things might be breaking (or even working correctly by accident).

Profiles Panel
The brand new JavaScript Profiler in the Profiles panel helps you identify where execution time is spent in your page’s JavaScript functions. The sidebar on the left lists all the recorded profiles and a tree view on the right shows the information gathered for the selected profile. Profiles that have the same name are grouped as sequential runs under a collapsible item in the sidebar.

There are two ways to view a profile: bottom up (heavy) or top down (tree). Each view has its own advantages. The heavy view allows you to understand which functions have the most performance impact and the calling paths to those functions. The tree view gives you an overall picture of the script’s calling structure, starting at the top of the call-stack.
Below the profile are a couple of data mining controls to facilitate the dissection of profile information. The focus button (Eye symbol) will filter the profile to only show the selected function and its callers. The exclude button (X symbol) will remove the selected function from the entire profile and charge its callers with the excluded function’s total time. While any of these data mining features are active, a reload button is available that will restore the profile to its original state.
WebKit’s JavaScript profiler is fully compatible with Firebug’s console.profile() and console.profileEnd() APIs, but you can also specify a title in console.profileEnd() to stop a specific profile if multiple profiles are being recorded. You can also record a profile using the Start/Stop Profiling button in the Profiles panel.
Databases Panel
The Databases panel lets you interact with HTML 5 Database storage. You can examine the contents of all of the page’s open databases and execute SQL queries against them. Each database is shown in the sidebar. Expanding a database’s disclosure triangle will show the database’s tables. Selecting a database table will show you a data grid containing all the columns and rows for that table.

Selecting a database in the sidebar will show an interactive console for evaluating SQL queries. The input in this console has auto-completion and tab-completion for common SQL words and phrases along with table names for the database.

Search
Accompanying the task-oriented reorganization, the search field in the toolbar now searches the current panel with results being highlighted in the context of the panel. Targeting the search to the current panel allows each panel to support specialized queries that are suited for the type of information being shown. The panels that support specialized queries are Elements and Profiles.
The Elements panel supports XPath and CSS selectors as queries in addition to plain text. Any search you perform will be attempted as a plain text search, a XPath query using document.evaluate() and a CSS selector using document.querySelectorAll(). All the search results will be highlighted in the DOM tree, with the first match being revealed and selected.

The Profiles panel supports plain text searches of the function names and resource URLs. Numeric searches are also supported that match rows in the profile’s Self, Total and Calls columns. To facilitate powerful numeric searching, there are a few operators and units that work to extend or limit your results. For example you can search for ‘> 2.5ms’ to find all the functions that took longer than 2.5 milliseconds to execute. In addition to ‘ms’, the other supported units are: ‘s’ for time in seconds and ‘%’ for percentage of time. The other supported operators are ‘< ’, ‘<=’, ‘>=’ and ‘=’. When no units are specified the Calls column is searched.

In all the panels pressing Enter in the search field or ⌘G (Ctrl+G on Windows and Linux) will reveal the next result. Pressing ⇧⌘G (Ctrl+Shift+G on Windows and Linux) will reveal the previous result. In the Resources, Scripts and Profiles panels the search will be performed on the visible view first and will automatically jump to the first result only if the visible view has a match.
Available Now and Contributing
All of these things are available now in the Mac and Windows nightly builds. Give them a try today, and let us know what you like (or don’t like).
If you would like to contribute, there are some really interesting tasks in the list of Web Inspector bugs and enhancements, and other contributors in the #webkit chat room are pretty much always available to provide help and advice.“
(Via Surfin‘ Safari.)